
The water industry, one of the most essential sectors in the world, and one of the least visible.
The pipes are underground. The treatment plants are tucked away.
The operators work in silence, and the public only notices when something goes wrong.
Digitalisation in water is not about technology for technology's sake. It is about making better decisions, faster, with the data we already have (yes you may already have many valuable data), and building systems that do not retire when people do.
We tend to take water for granted. Turn on the tap, water comes out.
Flush the toilet, it disappears.
But behind every litre of clean water delivered and every litre of wastewater treated, there are thousands of kilometres of pipes, hundreds of pumping stations, and teams of skilled operators making decisions every single day, often with incomplete information.
Marco put it simply: the traditional approach is to hire a consultancy, give them your data, wait weeks, get a report, and then... try to follow up.
The problem is that a report is a snapshot. Reality is a moving picture. By the time the recommendations are implemented, the conditions may have already changed.
“The worst thing is doing something efficiently that shouldn’t be done at all.” — Rory Sutherland, as quoted by Marco during our conversation.
This is where real-time analytics changes everything. Not because it replaces human judgement — it doesn’t, I hope… — but because it arms the operator with the right information at the right moment.
It turns a reactive industry into a proactive one.
The leakage paradox: we know the problem, but not where it is
One of the clearest examples Marco gave was around non-revenue water.
Most utilities know they are losing water. The question is where.
We already reviewed the main common technologies that main utilities use in their daily operations, in some previous episode.
And that gap, between knowing a problem exists and knowing where to act, is exactly where digital tools can make a transformative difference.
InfoTiles connects SCADA readings with network GIS data to model risk across every pipe in a district metered area.
The resul is “these specific pipes, in this specific area, near the river, carry a substantially higher risk than their neighbours, start there.”
That is the difference between sending a team out with a general brief and sending them with a precise target.
And in an industry where budgets are highly stretched and operational time is precious, precision is key.
The same logic applies underground, in the sewer
What surprised me most was seeing the same framework applied to wastewater.
The challenge there is inflow and infiltration, unwanted water entering the sewer system through cracks, faulty joints, or groundwater intrusion (countries such as UK, Italy, Poland, Belgium, have real issues in this aspect).
You might know the problem exists at the treatment plant level, but when the network connected to that plant covers 1,000 or even 2,000 kilometres of pipe, “somewhere in the network” is not actionable.
What InfoTiles does is map every pumping station to the pipes it serves, run a risk model, and express the result in terms of cost and even CO2 footprint.
Suddenly you are looking at a real operational and financial decision.
In their demo, four stations out of 150 accounted for 50% of the total unnecessary cost.
That kind of prioritisation is what turns a problem into a plan.
The silver tsunami and what we are about to lose
Marco used a phrase I had heard before but that hit differently in this context: the silver tsunami.
The wave of experienced operators approaching retirement, taking with them decades of tacit knowledge about how their specific networks behave, knowledge that was never written down, never digitised, never transferred.
This is one of the most underappreciated crises in the water sector, but actually applies to all societies with certain demographic population status.
And it is not just a human resources problem. It is a decision quality problem.
When the person who knew intuitively that “that pump always acts up after heavy rain in October” retires, and that knowledge is not documented anywhere, the next operator starts from zero.
The goal of a well-designed digital platform is to capture that institutional knowledge — in the data, in the models, in the alerts — so that a newly qualified engineer and a 30-year veteran arrive at the same decision when facing the same problem.
If you graduated yesterday or if you have thirty years of experience, you should both arrive at the same conclusion. That is what data analytics is trying to solve.
The real barriers are not technical
I asked Marco directly: what is stopping this from scaling faster?
His answer was honest and revealing. In the early days, it was access to data, utilities were reluctant to share because of uncertainty about data quality, or simply because they had never been asked to trust an external platform with their operational information.
But the deeper barrier is cultural. The water sector is, by nature, risk-averse. And the consequences of getting it wrong can be serious. But that same conservatism can slow the adoption of tools that would dramatically reduce operational risk in the long run.
There is also the feedback loop problem. In digital advertising, you run a campaign and see results in hours.
In water infrastructure, you invest in pipe rehabilitation and measure the impact over months or years.
That long feedback loop makes it harder to build the internal business case even when the data is sitting right there, ready to be read.
Questions worth asking in your own organisation, for operators and utility managers:
Do we know not just how much water we are losing, but where, and in which part of our network is the risk highest right now?
When an experienced operator retires this year, what decision-making knowledge leaves with them and where is it documented?
Are our SCADA and GIS systems talking to each other, or are we still doing that join manually in a spreadsheet?
If we fixed the top five most critical zones in our network today, what would be the year-on-year cost saving, and do we even know what those zones are?
Is our reluctance to share operational data with a digital platform about genuine risk or is it inertia?
A note on AI, and keeping it honest
We also talked about the role of AI in all of this.
The temptation in any industry is to layer generative AI on top of everything and call it innovation.
But in water, where the data is complex, the formats are non-standard, and trust takes years to build, the smarter question is: where does AI genuinely add value and where does it just add noise?
I’m preparing a specific workshop and course with Sandro Hanseen about AI in water. If there is any topic you’d prefer us to focus on, let us know in this poll so we can prioritize what the audience needs most.
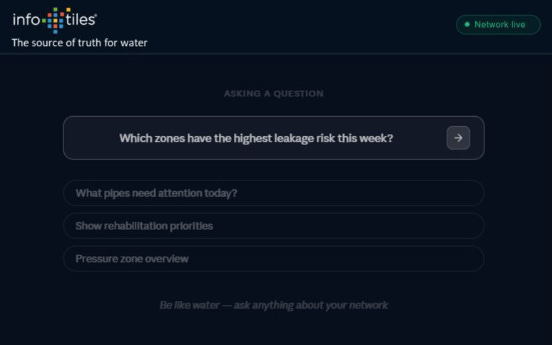
Imagine an operator asking, in plain language, “what should I do today?” and receiving a prioritised, evidence-based answer drawn from real-time sensor data, network models, and historical performance.
That future is closer than most utilities realise.
Wait, wait… the future has already caught up with us! Do you realize how fast everything is evolving, and how important it is to stay updated in our industry?
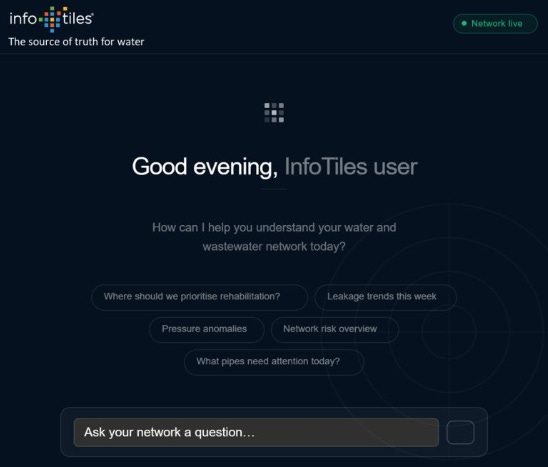
A Large Language Model (LLM) on top of PipeFusion, reading the outputs of our graph-based network (GNN) analysis and converting them into plain-language decisions.
Water and wastewater networks are complex. A single utility may manage tens of thousands of pipe segments, valves, sensors, and connections across ageing infrastructure with highly variable data quality. We have spent years building tools grounded in graph theory to model flow, detect anomalies, and quantify risk across every asset in a network.
The persistent challenge has been the last mile. Our models can identify that a specific asset carries elevated failure probability. What they could not easily do, until now, is tell an operator what to do about it, in the context of budget constraints, operational history, and comparable interventions.
By connecting the LLM to our risk and graph outputs, the system can reason across thousands of assets simultaneously. It surfaces the interventions most likely to reduce risk per unit of spend, explained in language a decision-maker can act on directly.
This work is part of a formal R&D programme supported by Norges forskningsråd (the Research Council of Norway). That backing matters. The work is structured, independently held to standard, and built to go well beyond proof-of-concept.
We are in early conversations with utilities who want to be part of this journey. Security, compliance, and data governance are not afterthoughts, they are part of the process from day one. Critical infrastructure demands that standard, and we hold ourselves to it.
This was a controlled test, not a production deployment. But the results were clear enough to give us genuine confidence that we are building something useful for the people responsible for delivering water to our homes and taking it away again.
What I took away
There is a phrase Marco used early in our conversation: water first, software second. It sounds simple, but it is actually a reframing of what digital transformation in this sector should mean.
The technology is not the point. The water — keeping it clean, preventing it from being lost, treating it safely, delivering it affordably — is always the point.
The best digital tools in this space are the ones that get out of the way and let skilled operators do their jobs better.
They do not replace expertise, they amplify it. They do not add complexity, they reduce it.
And they do not promise miracles, they make the next right decision a little clearer, a little faster, every single day. Like The Water MBA :)
That, to me, is what transformative digitalisation actually looks like in the water sector. An evolution, quiet, rigorous, and deeply necessary!


